
In our recent post, we’ve talked about the importance of A/B testing. It’s one of the hottest marketing practices in 2020, and there’s no way it’s going anywhere in 2021. In the era of extreme competition, you want to play it safe even when taking risks.
A/B testing is an extremely useful methodology that’s capable of making your business performance skyrocket. The truth is, it’s only possible when you do it right. You need to know exactly what you’re doing when running your experiments to ensure accurate significant results. To do that, you need to cover the methodology first.
A Step-by-Step Guide to A/B Testing
Step 1: Do Your Research
Before you can start A/B testing your marketing assets, you have to get a solid idea of what’s keeping you from harnessing your full potential at the moment. You need to conduct thorough preliminary research of the areas that require improvement, identify both opportunities for growth and possible pitfalls that require a bit of work done on them.
Fortunately, the market is saturated with various research tools that can simplify the process for you and give you an insight into your website’s (or any other marketing asset) performance. Here are some of the most useful tools for you to add to your arsenal:
- Landing Page Analyzer. This free tool allows you to analyse your website’s landing page to see how effective it is. On top of that, it also offers an actionable report on your landing page’s problem areas and recommendations on how to improve them. The criteria used for analysis include the following 5 parameters: Relevance, Propensity to take action, Persuasiveness, Motivation, and Focus on the goal.
- Google Analytics (GA). A part of the Google products family, this extremely potent free web analytics tool allows you to track your website traffic and get statistically significant insights on the website visitors’ behaviour. As soon as you add it to your web page, it starts automatically collecting data and forming reports based on it. It’s also possible to integrate Google Analytics with other tools such as Google AdWords to get a more holistic picture of your business performance.
- VWO Heatmaps. Unlike the previous two tools that mostly present statistical information in the form of a numerical spreadsheet, Heatmaps by VWO offer visual representations of how visitors interact with your website, including heat maps, scroll maps, click maps, click area, etc.
In fact, heat maps — aggregated visualization of user mouse movement, scrolling, clicks, and taps — are one of the most effective tools for a preliminary research as they help to not only obtain statistical insight into the problem, but also understand why that might be happening.
Example. Let’s use the Nurse.com old landing page’s heat map to explain the importance of research for successful A/B testing.

The main goal of any landing page is to convert. In the case of Nurse.com, the landing page was intended to urge the visitors to click on the ‘Buy Unlimited CE Membership’ button and become Nurse.com’s customers.
The Nurse.com heat map reveals that only a few site visitors actually follow through and act as expected. The rest of them get distracted from the main element and end up clicking elsewhere. Some of the key problems with the landing page in question are:
- There are two competing calls to action that divide the clicks between themselves.
- There are several not obviously non-clickable elements that users try to interact with.
- There are lots of less-important links that distract the users’ attention from the ‘main course’.
- The main copy on the page gets ignored.
As a business owner, you know exactly what needs to be clicked. Hence, you’re biased - you can’t possibly know what the people who see it for the first time will struggle with. Therefore, none of the aforementioned factors is really that obvious. All four of them, however, comprise the weak performance of the landing page.
Forming a heat map allows getting a user’s perspective of the website instead of formulating a subjective hypothesis.
Nonetheless, even with such a wide range of automatic analytical tools available to marketers, it’s still advisable you work on developing analytical skills, too! No matter how great the technology you use is, it’s always a good idea to mix the research up with a bit of human expertise.
Luckily, there’s a resource for that, too!
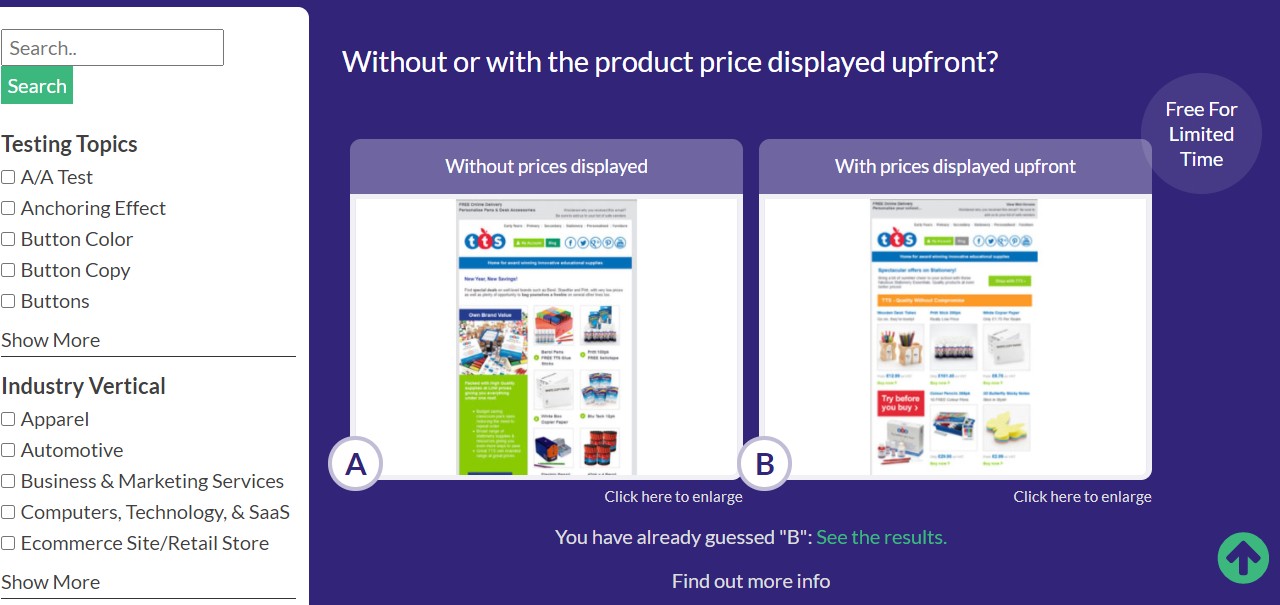
🔥 NetHunt Pro Tip: To learn more about general website visitors’ preferences, use Guess The Test.
It’s a gamified platform with one of the largest, most comprehensive collections of A/B testing case studies on the internet. It allows you to put your mind to test and guess which of the two test variants garners the most conversion. After you give your judgement, regardless of whether you pick the winner or not, you get to see the real results of the A/B test, as well as all the supporting documentation for it.
Step 2: Observe to Formulate a Hypothesis
As soon as you have completed your research, you should be able to make an educated guess regarding what affects your marketing assets’ performance, and in what way. Your research allows you to put forward a data-backed hypothesis, a proposed explanation for a phenomenon.
There are several requirements that need to be met for a hypothesis to be good:
- It’s possible to test. Your hypothesis needs to be measurable in order to be tested. Otherwise, you’ll end up getting subjective results that cannot be justified statistically.
- It helps to solve a conversion problem. Every hypothesis you formulate is based on the belief that it can increase the conversion rate of the marketing asset in question.
- It provides market insight. Either if your variant ‘wins’ or ‘loses’, it should still give you a better understanding of your target audience’s needs and wants. If you manage to articulate your hypothesis well, it’ll provide you with it regardless.
“If you can’t state your reason for running a test, then you probably need to examine why and what you are testing.”
[Brian Schmitt, Conversion Optimization Consultant, CROmetrics]
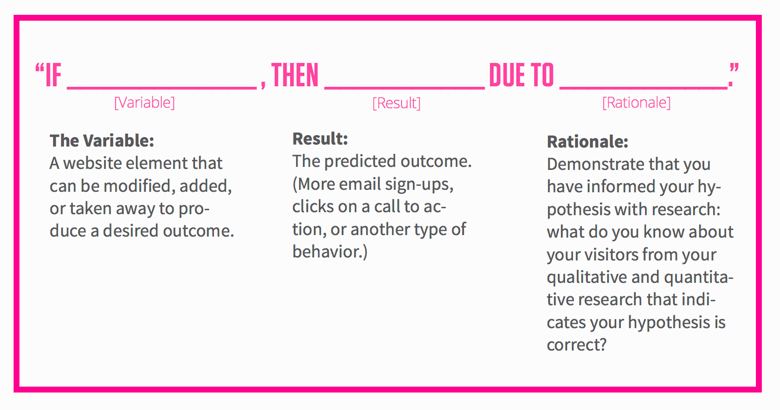
A basic A/B testing hypothesis statement has three crucial components and is normally structured as follows:
‘If _____ then _____ because ______’
- The variable. The WHAT of your test - the element you’ll be changing in the course of your A/B testing process.
- Result. The SO WHAT of your test - what you expect to happen once you’ve made changes to the variable.
- Rationale. The WHY of your test - the reasoning behind your suggestion, research-based data that makes you believe that a certain change of the variable will lead to a certain outcome.
🔥 NetHunt Pro Tip: Even if you believe several elements have an effect on your marketing asset’s performance, stick to only testing one variable at a time. That way, you’d have a better understanding of how effective the change is.
However, it doesn’t mean that you can bend any statement you want to fit the aforementioned structure and call it a day. Instead, you should approach the process strategically and formulate your hypothesis using one of the following methods:
- Hypothesis for every outcome. Instead of experimenting for the sake of experimenting, ensure that regardless of the outcome of your experiment, you’ll get a valuable piece of information. Think ahead and hypothesis an explanation for both a ‘win’, a ‘loss’ and a ‘draw’.
- Make the hypothesis relevant to your key KPIs. Ensure that your experiments and hypotheses are oriented towards improving your company’s key performance metrics.
This way, you’ll be able to formulate an actionable hypothesis.
With all the aforementioned points in mind, Craig Sullivan, an A/B testing pro, has developed an A/B testing hypothesis kit.
Simple Kit
1. Because we saw (data/feedback)
2. We expect that (change) will cause (impact)
3. We’ll measure this using (data metric)
Advanced Kit
1. Because we saw (qual & quant data)
2. We expect that (change) for (population) will cause (impact(s))
3. We expect to see (data metric(s) change) over a period of (x business cycles)
🔥 NetHunt Pro Tip: Make sure you document all your hypotheses and link them back to the relevant pieces of research that allowed you to make the suggestions. It can be used as a reference for future tests.
Step 3: Last Preparations
Based on the hypothesis formulated in the previous step, you should now be able to identify the exact elements you need to test as well as all the possible changes to make to them.
At this point, you need to create a set of challengers (alternatives) to your controller (the existing version of your marketing asset). Here, however, comes the tricky part - how do you know when to stop? How many variables should you test?
In theory, there isn’t a limit for the number of variants you can test the same way there isn’t a cap on the number of variables to change. It all boils down to the resources available to you - if you have enough money, time and traffic to test out hundreds of minor alterations, you’re more than welcome to do so!
Realistically speaking, however, if you don’t have a fortune to spend on A/B testing, you should go for 3-4 variants for each variable.
Since we’ve already dipped our toes into the ‘how many’ waters, let’s take a look at other numbers we need to decide on while we’re here. The prime drivers of A/B testing success are having a sample group big enough and running the test for long enough. Makes perfect sense, doesn’t it - the more, the merrier! Well… Not quite. Sometimes, doing too much can hurt. Instead, just stick to the optimal size and time-frame, especially since they’re easy to calculate.
- Determining the optimal statistical significance of an A/B test.
One of the biggest perks of A/B testing is the fact that it’s data-driven and, therefore, accurate. The last thing you want to do is ignore the fact that not all results are significant. To take that into consideration, you need to calculate the statistical significance of your experiment. It shows how likely it is that the difference between your experiment’s control version and test version isn’t due to error or random chance. You can do it here.
🔥 NetHunt Pro Tip: 95% is an accepted standard for statistical significance but you can go for a different figure based on your risk tolerance.
- Calculating the optimal sample size for an A/B test.
You need to make sure that you show your variants to a sufficient number of people. Otherwise, the results of your testing will be flawed. Optimizely samples size calculator allows you to calculate the optimal sample size based on baseline conversion rate, minimum detectable effects and statistical significance. - Calculating the optimal duration of an A/B test.
Calculate the duration for which you should run A/B tests using VWO’s free Duration Calculator. It estimates the duration for which you should run your test to conclude with statistical significance based on 5 parameters:
- estimated existing conversion rate;
- minimum improvement in conversion rate you want to detect;
- number of variations/combinations (including control);
- the average number of daily visitors;
- percentage of visitors included in the test.
🔥 NetHunt Pro Tip: Run tests for two business cycles to mitigate external factors such as daily traffic differences, email marketing and content marketing schedule, external events.
Step 4: Run Tests and Analyse the Results
As soon as the previous steps are completed, you’re good to go and can finally kickstart your A/B testing process.
Take all the A/B testing elements that you have and fit them into your A/B testing tool of choice. Depending on the marketing asset you’re trying to optimise, the best testing tool will vary. However, these are considered to be the big boys in the game regardless of whether you’re experimenting with a web form, an email, a CTA or a landing page:
- Optimizely
- VWO
- Convert Experiences
When running your tests, make sure you stick to your testing plan and give your tests enough time to provide you with significant results discussed in the previous step. Speaking of time… It’s also mandatory for you to test all variants simultaneously so that your A/B testing results were as unbiased as possible.
Once you’ve reached the required statistical significance, sample size and duration of the A/B test, you may discontinue the test and analyse the results.
Basic A/B testing results are usually straightforward to interpret. All you need to do is to track the primary goal (conversions) within your A/B testing tool.
However, you can up your game and expand the framework of your results analysis to cover advanced analysis, too! Most A/B testing tools allow you to add custom metrics to track so that you can have a better insight into the performance of each variant. Some of the things you can analyse include:
- Is this test performing differently for new/returning visitors?
- Does a variation work particularly well for a specific traffic source?
- How does a variation perform in a specific browser/on a specific device?
Comparing and contrasting sets of figures will let you decide whether the challenger is the winner or the loser. If it drives more conversions and overall performs better than the original controller, you can implement changes. If not… Keep trying!
Besides, if your hypothesis is good, even if your variant fails, you’ll still gain an insight into your users’ behaviour.
DOs and DON’Ts of A/B Testing
✔️ DO stay open-minded
The absolute most crucial thing to remember about A/B testing is that it can easily freak the hell out of you! It’s quite unpredictable and can result in an outcome you didn’t expect. Something you wouldn’t think have any impact on your target audience can actually drive the most changes. Alternatively, it could not work at all. There are lots of different ways in which your experiment can go, so you should be prepared for anything. Regardless of the results you get, think of it as a valuable learning experience and don’t stop working on improving yourself.
❌ DON’T call it a day too early
One of the most common A/B testing mistakes is calling the test too early. Make sure you stick to the planned time framework and don’t stop testing even if you hit the sample size or statistical significance figures earlier than expected. It can all change over time.
✔️ DO act on your test results
The worst thing you can do when A/B testing is running experiments just for the sake of it. After all, A/B testing is a laborious, time-consuming process. If you don’t actively utilise the results of your experiments, you’re wasting a heap of your business resources that could’ve been allocated elsewhere.
For positive results, it means implementing the changes immediately. For negative results - learning from them and drawing data-backed conclusions about the market, your business and your target audience.
❌ DON’T rush into testing
It can be extremely tempting to test everything you do to be sure you’re moving in the right direction. However, sometimes you need to back off and take a break. You can’t start testing as soon as you launch something simply because you won’t have enough data to compare your variant’s performance metrics against.
✔️ DO test multiple variables
There are lots of different elements that comprise your marketing assets, and all of them are capable of making an impact. You never know which one of the elements, e.g. CTA, colours, fonts or text, is the most important to your target audience. To find out for sure, you need to stop assuming and start testing.
Just remember that you should only test one variable at a time. Otherwise, you’ll never know which element generated the results.
❌ DON’T blindly follow A/B testing case studies
The internet is full of different A/B testing case studies, both successful and not. While it’s a great idea to go through them when you have time to learn more about the method, the possible outcomes, etc., you need to remember that the point of A/B testing is to generate business-specific results.
You’re looking to test out your solutions for your audience. Therefore, everyone else’s experience can easily prove to be irrelevant. You must use your research data when formulating a hypothesis, the testing framework and analysing the results.

Start small to go big! Don’t be afraid to experiment with your marketing assets, and eventually, you’ll find what works best for you.
Table of Contents
Crack the sales formula with CRM Lab
Twice a month, receive actionable CRM content to your inbox.